gwrefpy#
gwrefpy is an open source Python implementation of the Akvifär reference method for detecting deviations in groundwater level time series. The method is described in detail in Strandanger (2024).
User guide on installation and the basic concepts.
Some tutorials on how to use th epackage.
Application programming interface (API) reference.
A collection of gwrefpy exercises.
Key concepts behind gwrefpy and the Akvifär reference method.
The source code for gwrefpy is hosted on GitHub.
Features#
Programmatically fit observation wells to reference wells
Visualize fits and deviations
Save your work, share and pick up later with a custom
.gwreffile formatWork with live data and update your analysis as new data comes in
Quick Example#
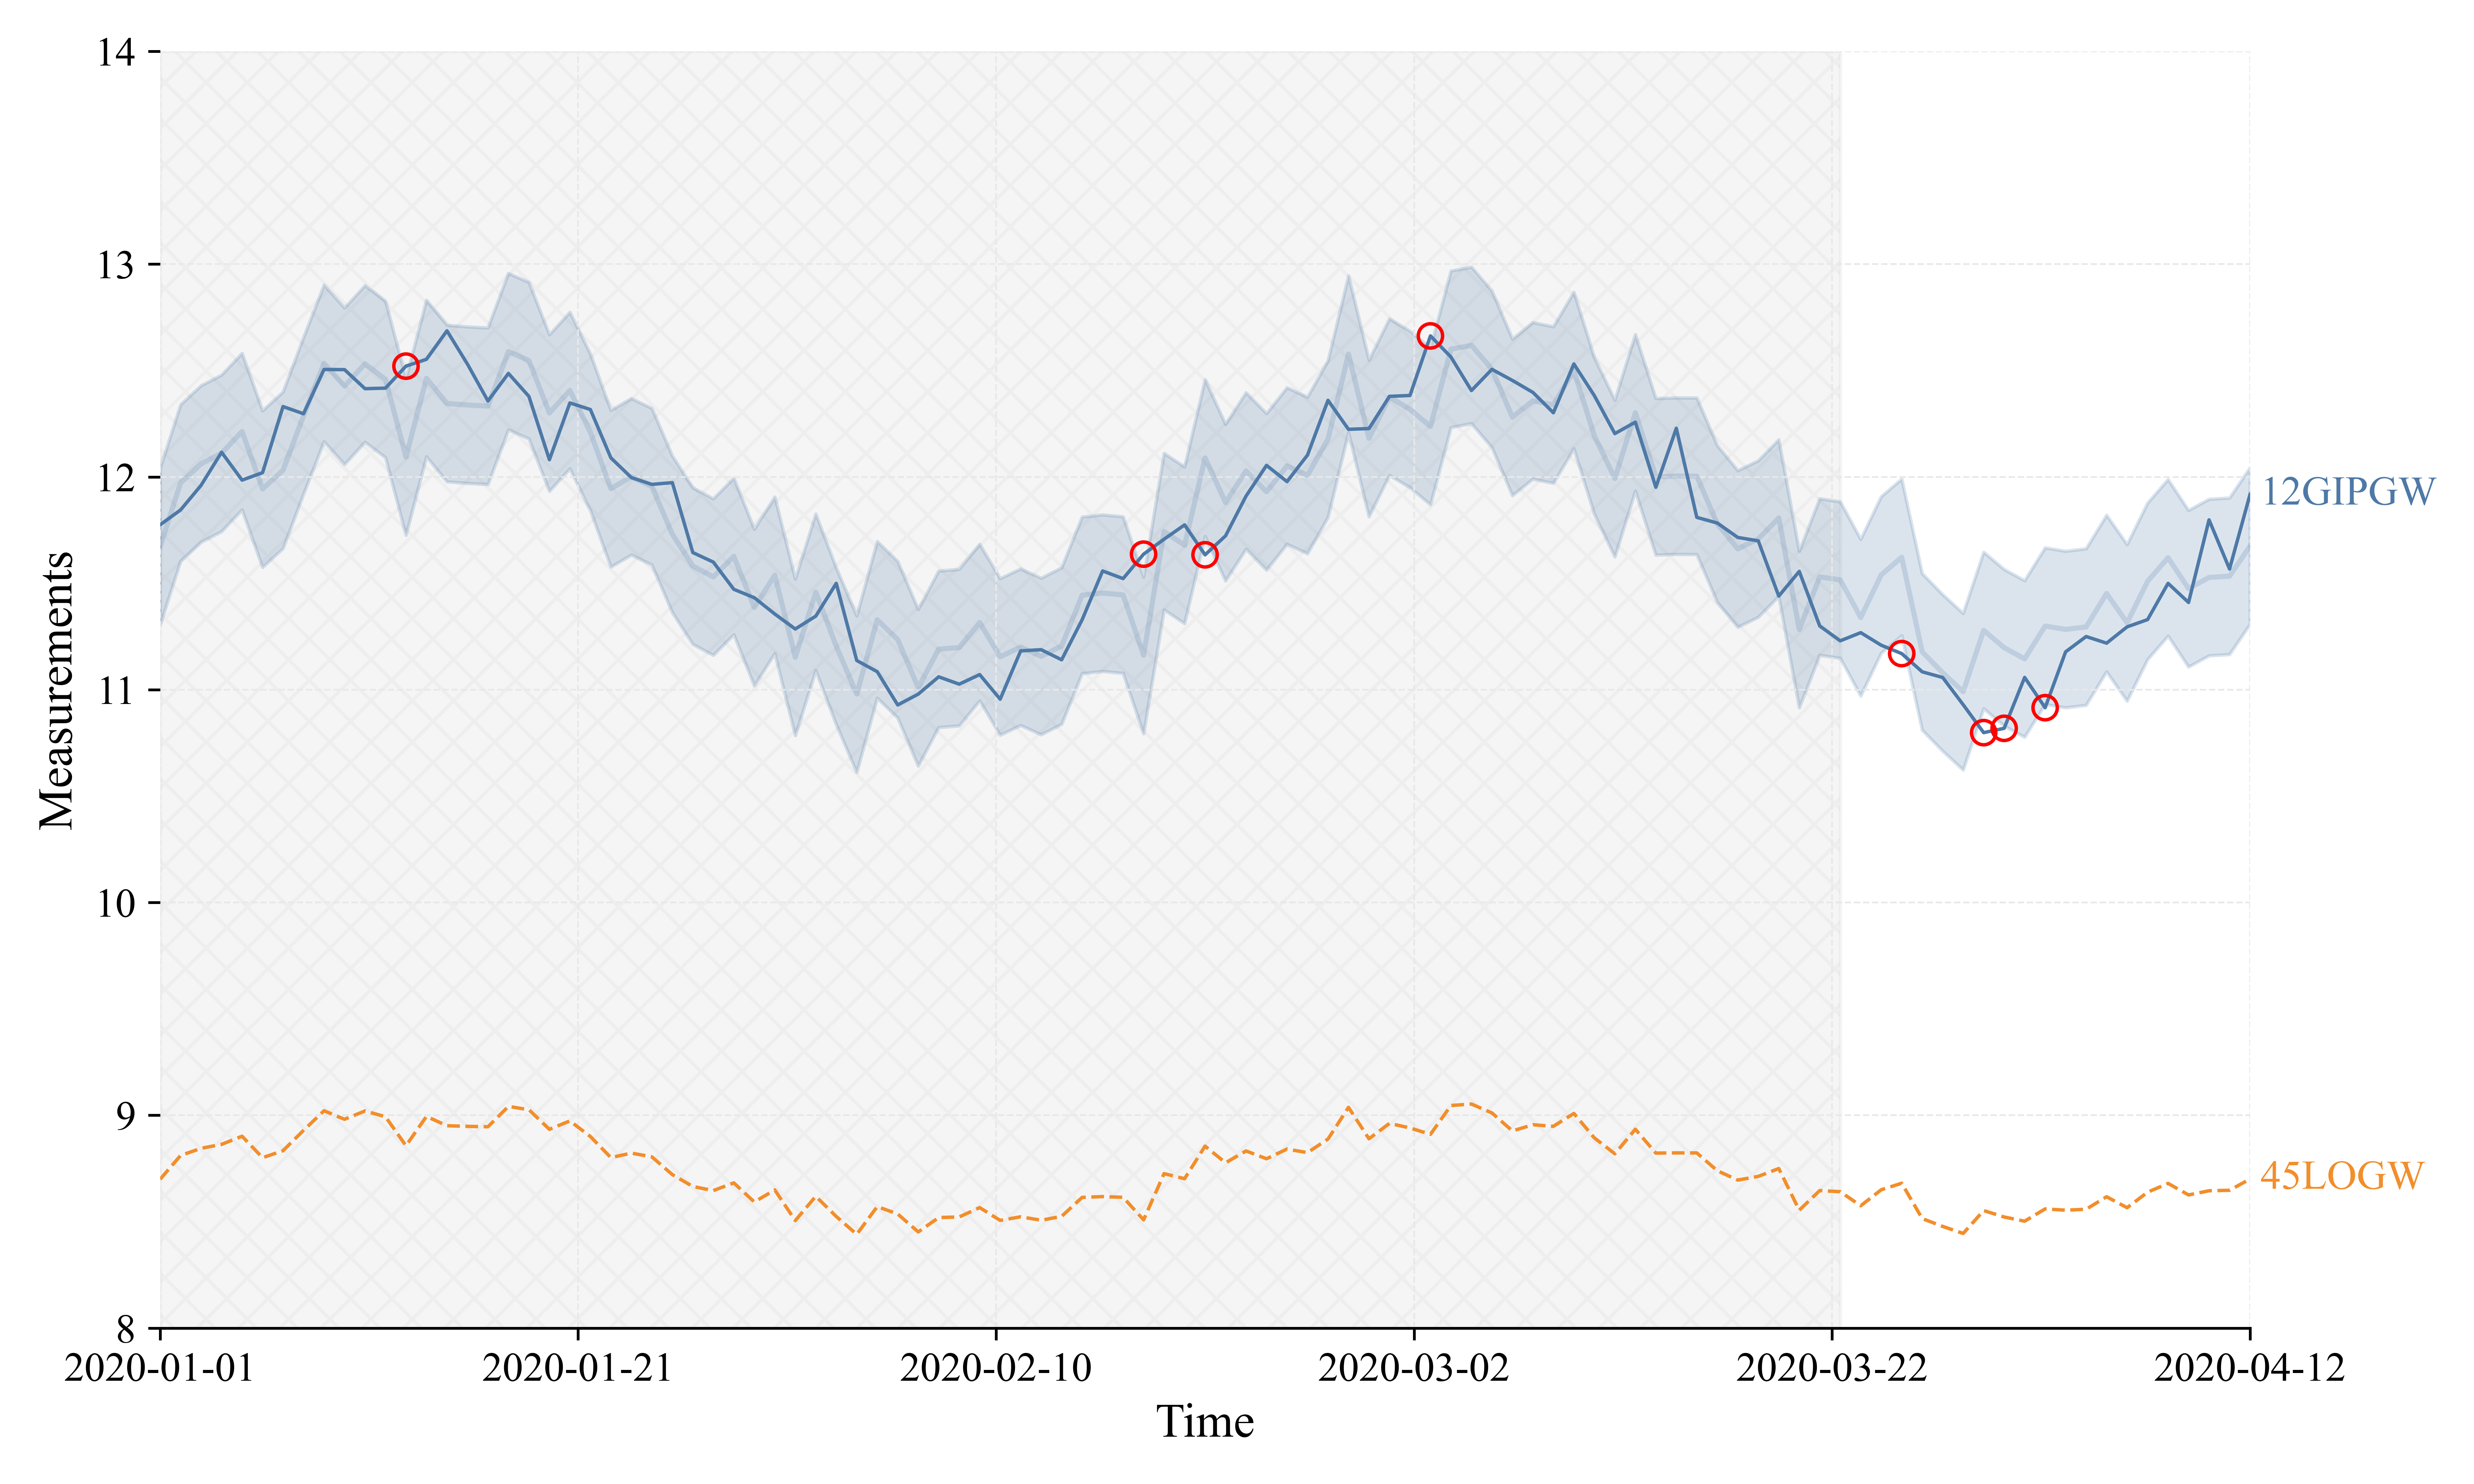
In this example an observation well and reference well are fitted and plotted.
# Import the packages
import gwrefpy as gr
import pandas as pd

# Load timeseries data from CSV files
obs_data = pd.read_csv("obs.csv", index_col="date", parse_dates=["date"]).squeeze()
ref_data = pd.read_csv("ref.csv", index_col="date", parse_dates=["date"]).squeeze()

# Create Well objects and add timeseries data
obs = gr.Well(name="12GIPGW", is_reference=False)
obs.add_timeseries(obs_data)

ref = gr.Well(name="45LOGW", is_reference=True)
ref.add_timeseries(ref_data)

# Create a Model object, add wells, and fit the model
model = gr.Model(name="Small Example")
model.add_well([obs, ref])

model.fit(obs_well=obs, ref_well=ref, offset="0D", tmin="2020-01-01", tmax="2020-03-23")

# Plot the results
model.plot_fits(plot_style="fancy", color_style="color", show_initiation_period=True)

